
Research paper
2 min
Dancing in the dark – When price signals lead investors astray


Despite the extraordinary times we live in, both geopolitical and from an investment perspective, it seems investors have been unwilling to recognise that the ‘party’ of the past decade is over. Encouraged by an exceptional quarter for the value investment style, we believe the long-awaited turn for 'value' has only just begun and we see an encouraging outlook.
It is difficult to write any investment piece at this time without acknowledging the horror and tragedy of what is unfolding in Ukraine. More so, because events in that part of the world have exacerbated significant trends that were already impacting global economies – a quickly developing energy crisis and rising inflationary pressures. During the quarter the US Federal Reserve raised interest rates for the first time since 2018 and indicated that a further six increases were likely this year as they move to more aggressively reining in inflation. While it is not unusual for markets to continue to rise during tightening cycles, there do appear to be more challenges than usual to investors’ views that the good times will continue to roll. In particular, the likelihood that Tech and growth stocks, the prime beneficiaries of supportive monetary policies of the past decade, can continue to lead market indices over the longer term seems improbable.
There has been a decisive recovery in the performance of value managers since October 2020. As is usually the case, the recovery has not been visible month by month and there have been times when faith in the recovery has been tested, as was the case in the latter part of last year. However, this past quarter was exceptional, and as we look back over the past ~18 months, the moves in total have been very material. The pace of the performance recovery more recently has caused some to ask whether in fact this is it – has value had its time in the sun?
It is informative to analyse where the performance recovery has come from for insight into what might lie ahead. As we look at the performance of our flagship Australian Equity Trust, we note that approximately a third of the outperformance has been generated from material and energy names, a third from the retracement of healthcare and Tech stocks that we do not own and the remaining third from a mix of a recovery in value stocks (such as financials) and a retracement of other stocks we don’t hold. In total more than 40% of the recovery in performance has come from stocks that we do not own. This is important as it highlights the positive contribution from ‘not held’ stocks that had negatively impacted performance over the medium term and causes us to ask how much more might come from this source. The best performing stocks of the past decade have generally been growth stocks, typified by healthcare and Tech names. As a very broad generalisation, many of these stocks enjoyed price earnings (PE) multiple re-ratings over this period that saw these multiples stretch to two standard deviations above mean. Over the past 18 months, the PE multiples have slipped to ‘only’ one standard deviation above mean – hardly a bargain!
Industrial stock valuations continue to look excessive

Source: Goldman Sachs, data to March 2022.
The chart highlights one key aspect of the upside scenario for value – the continued de-rating of the PE multiples of favoured industrial stocks. What has been ignored by many investors during the relentless positive re-rating of the past decade is that a mean is comprised of readings both above and below that outcome and we have lived in a decade where investors have only really seen the upside outcome. A review of history suggests that a period of extreme overvaluation is often followed by capitulation and a subsequent period of undervaluation – witness what happened post the Tech Bubble in 1999/00 and then post the GFC in 2007/08. In the current uncertain environment created by rising inflation, tightening monetary policy and significant geopolitical uncertainty, it seems to us investors will be increasingly wary of paying premium multiples for such stocks. Herein lies one of the large opportunities for value.
Further, a review of the industrial stocks held in our portfolio highlights that few have contributed materially to the strong performance generated over the past ~18 months. Many of these stocks remain unloved and trading at material discounts to both our valuations as well as to market multiples. The next chart shows the wide PE multiple spread between the most expensive stocks and the cheapest stocks in the market and again highlights the opportunity for value to continue to perform strongly – both through the positive repricing of value names and/or the de-rating of highly priced growth stocks as discussed above.
Price earnings multiple spreads narrow considerably
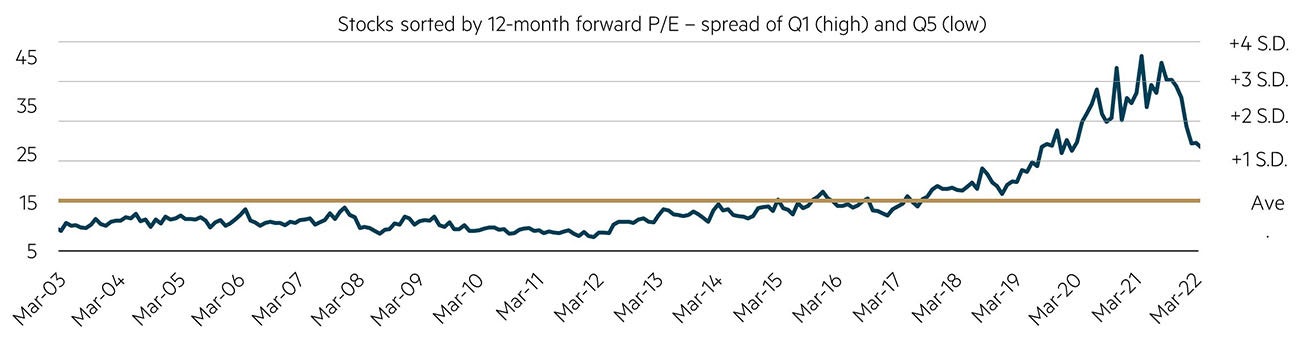
Universe is the ASX200 industrials ex-Financials. Note: Quintile next twelve months (NTM) P/E is based on a 40% trimmed mean. Source: Goldman Sachs, data to March 2022.
Finally, it is worth highlighting some of the strong moves we have seen in commodity prices and the related flow through to the earnings of producers – clearly seen in the February reporting season. Both BHP and Rio Tinto reported earnings that were very high on an historic basis, while Woodside Petroleum saw a sharp recovery in earnings. While share price performance for these types of stocks has been strong, we have seen significant PE multiple erosion as the market has sought to look through what appears to be peak earnings and focus on what earnings might look like on the ‘other side’. As a result, on a backward-looking PE multiple basis the resource sector is trading as cheaply as it has in 20 years.
Resource multiples are low – but on extended earnings
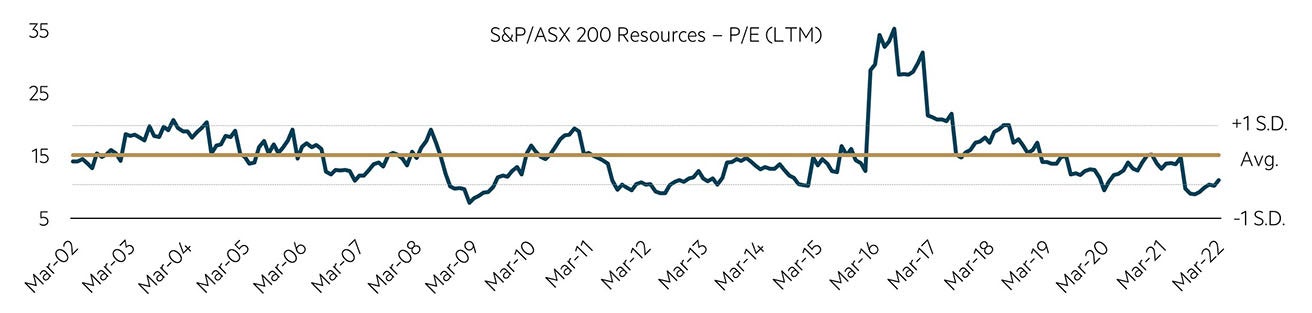
Source: FactSet, data to March 2022.
Given current geopolitical turmoil and increasing signs that inflation may well be more enduring than many allowed for, the question is whether we might see commodity prices at elevated levels for (much) longer than is implied by current share prices. As we saw in the resource cycle of the mid-2000s the excess cash flow that is generated during such periods can be very meaningful and sustain share prices at higher levels for much longer than expected, notwithstanding the stocks trading at discounted PE multiples for much of the period. We retain an overweight position to the resources sector, with a particular emphasis on energy.
In summary, markets have delivered exceptional returns to investors on the back of extremely supportive monetary policies. Central banks are finally beginning to fret about the aftermath of these policies, while investors recognise that change is on the way. However, investors still seem to believe monetary authorities will not have the fortitude to follow through, or they are already looking through higher interest rates to a marked economic slowdown that again sees interest rate support returning. Given the US has seen one rate increase of the many forecast, this seems an extraordinarily long-dated and hopeful view to take! In our view, the party is over, and the adjustment process is probably only in its early stages. We believe the turn for the value style is just getting started, enhanced by how little money remains invested with the value manager community in Australia.
Disclaimer
This material was prepared and issued by Maple-Brown Abbott Ltd ABN 73 001 208 564, Australian Financial Service Licence No. 237296 (MBA). MBA is registered as an investment advisor with the United State Securities and Exchange Commission under the Investment Advisers Act of 1940. This information is intended solely for professional and institutional investors and is provided for information purposes only. This material is not intended for, and is not suitable for, retail clients and does not constitute investment advice or an investment recommendation of any kind and should not be relied upon as such. This information is general information only and it does not have regard to any investor’s investment objectives, financial situation or needs. Before making any investment decision, you should seek independent investment, legal, tax, accounting or other professional advice as appropriate. This material does not constitute an offer or solicitation by anyone in any jurisdiction. This material is not an advertisement and is not directed at any person in any jurisdiction where the publication or availability of the information is prohibited or restricted by law. Past performance is not a reliable indicator of future performance. Any comments about investments are not a recommendation to buy, sell or hold. Any views expressed on individual stocks or other investments, or any forecasts or estimates, are point in time views and may be based on certain assumptions and qualifications not set out in part or in full in this information. The views and opinions contained herein are those of the authors as at the date of publication and are subject to change due to market and other conditions. Such views and opinions may not necessarily represent those expressed or reflected in other MBA communications, strategies or funds. Information derived from sources is believed to be accurate, however such information has not been independently verified and may be subject to assumptions and qualifications compiled by the relevant source and this material does not purport to provide a complete description of all or any such assumptions and qualifications. To the extent permitted by law, neither MBA, nor any of its related parties, directors or employees, make any representation or warranty as to the accuracy, completeness, reasonableness or reliability of the information contained herein, or accept liability or responsibility for any losses, whether direct, indirect or consequential, relating to, or arising from, the use or reliance on any part of this material. Before making a decision whether to acquire, or to continue to hold an investment in the Fund, you should obtain and consider the current PDS, AIB and Target Market Determination (TMD) for the Fund issued by MBA and available at maple-brownabbott.com.au/document-library or by calling 1300 097 995. This information is current as at 31 March 2022 and is subject to change at any time without notice.
© 2022 Maple-Brown Abbott Limited
Interested in investing with us?
We are a disciplined Australian equities value manager that has been managing Australian equities since we were established in 1984. Over time we have made refinements to our investment process, however our commitment to value investing remains unchanged.