
Media release
1 min


This article was first published on Livewire Markets on 11 July 2022.
Many Australian small cap companies have fared well since the initial COVID shock of 2020, with stimulus-driven demand and a benign cost environment leading to a solid operating environment. As conditions become more challenging, we believe it is as important as ever not to ‘anchor’ current forecasts on the most recent set of results. With potentially slowing demand and elevated cost inflation, we foresee downside risk to market expectations, notably margin expansion into FY23.
The S&P/ASX Small Industrials Index (Small Industrials)* has experienced a sharp multiple de-rate recently, from a forward-looking P/E ratio of 25x to 17x today, which is broadly in line with the 10-year average. We believe that the market de-rate reflects both tightening financial conditions and rising recession risks.
Small industrials index
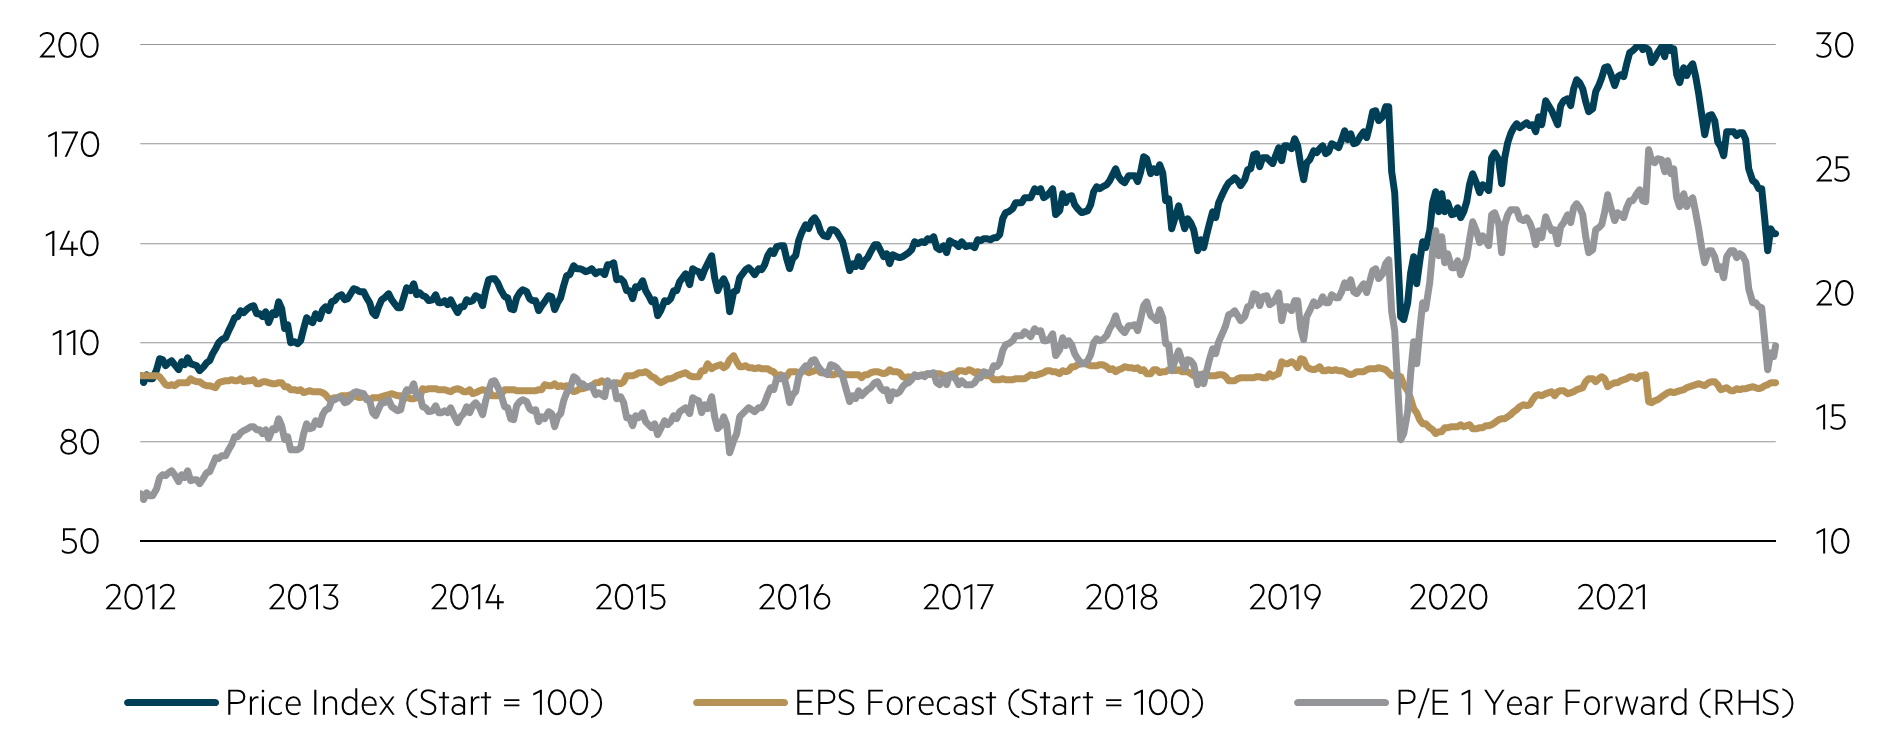
Source: Factset, data as at 4 July 2022.
Picking a multiple for stocks to trade on is challenging and highly subjective, and there are also significant concerns around earnings expectations – the ‘E’ in the P/E ratio. Consensus earnings expectations have still been rising in recent months, which is contrary to the feedback on the ground that we are hearing from many companies – that cost pressures are negatively impacting margins and price rises will either only partially offset this headwind or take time to be implemented.
We are starting to see companies downgrade earnings expectations during the pre-reporting ‘confession season’, with labour shortages, rising energy prices and wet weather common themes seen so far. We see downside risk in aggregate earnings forecasts for the Small Industrials segment at the coming reporting season because many of these factors are not one-offs and may persist for at least the next 12 months.
We believe that cost inflation is only now starting to materially impact company earnings. Inflationary pressures seen during the first half of FY22 were generally in smaller cost lines (e.g. logistics and shipping) and could be offset through small price rises or other business efficiency measures. The cost increases companies are now facing are much more broad-based, primarily relating to cost of goods sold (COGS), such as raw materials, manufacturing costs and energy, and wages. A good example is seen in the recent Collins Foods (CKF) FY22 result, with the company noting:
“With inflationary pressure commencing in late FY22, there was only a modest impact from this on the full year margins.”**
We further believe that cost inflation is being compounded by a lack of available labour in many sectors, resulting in inefficiencies through businesses. Larger price rises will be needed to offset these cost increases and will test which companies truly have pricing power. These price rises, if accepted by customers, may also take longer to be implemented (given some customers might be on fixed-price contracts) and could lead to demand destruction if customers are unwilling to purchase as much of the product/service at elevated price levels.
The following chart shows a breakdown of costs for 30 companies in the Small Industrials, based on their most recent annual reports. These companies represent a broad and diverse cross-section of the Australian small cap industrial market, that are representative of the index composition.
Costs can be classified according to three broad buckets:
The chart shows how little most companies can do to their cost base in the very short term. Inflationary-linked costs vary between 30% and 98% of the total cost base but are 81% on average, whereas costs in the ‘levers’ bucket average only 7%, with a range of 0% to 32%. Facing higher COGS or wage growth in a short period of time leaves many companies unable to reduce marketing or other discretionary budgets quickly or sufficiently enough to offset this impact.
Cost breakdown
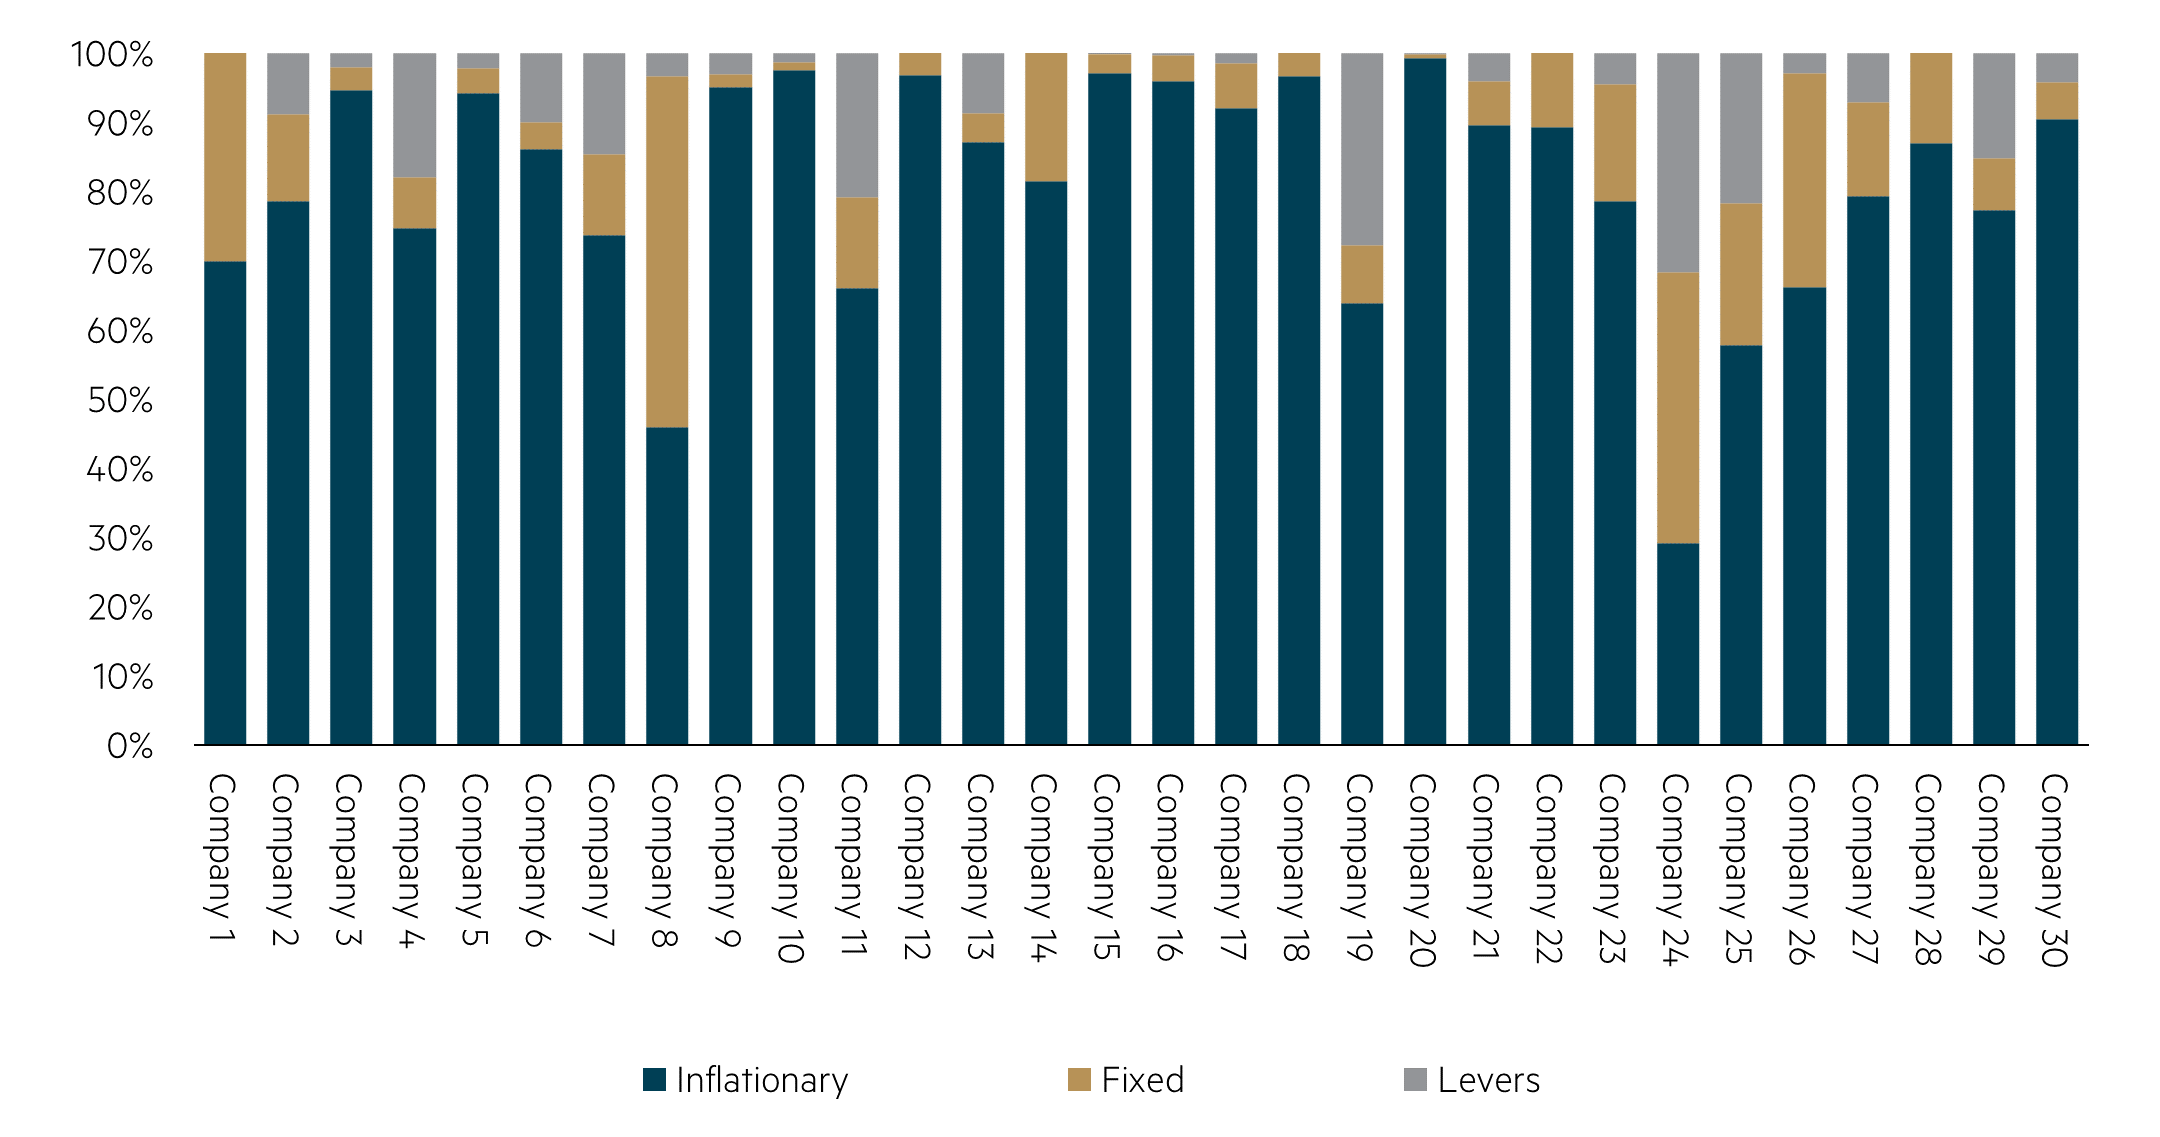
Source: Company annual reports FY22.
Margins across stocks in the Small Industrials recovered somewhat in FY21, with consensus estimates showing minor margin expansion is likely in the upcoming FY22 results.
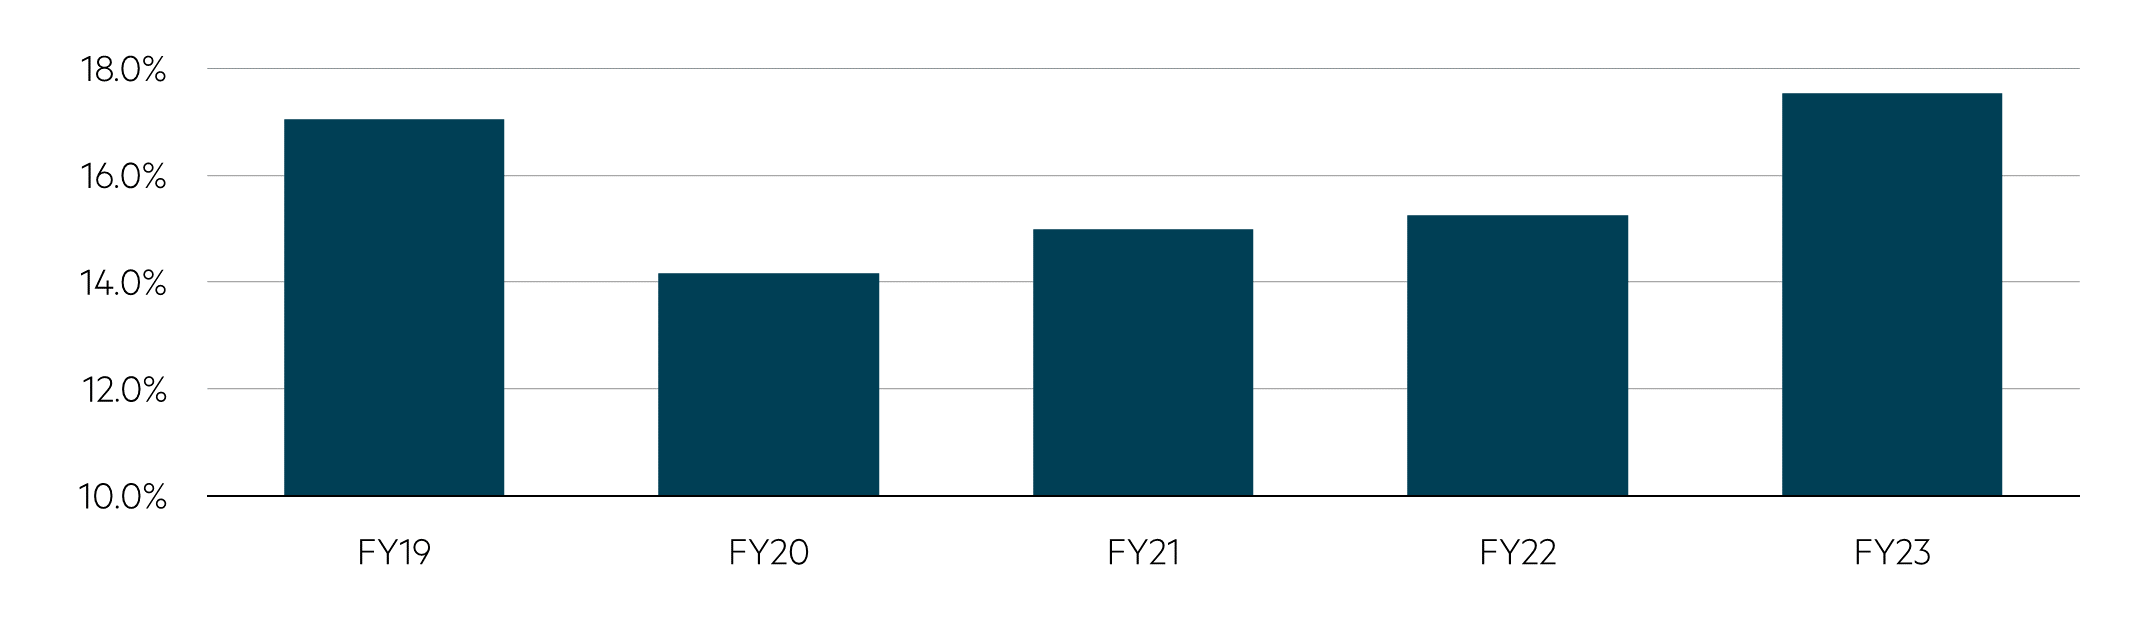
Source: Factset, data as at 4 July 2022. Data consists of 108 companies in the S&P/ASX Small Industrials Index (excluding REITs and loss-making companies). Forward-looking statements, including projections and estimates, are provided as a general guide only and should not be relied upon as an indication of the future performance.
This result reflects a mix of sector fortunes, with some sectors such as travel still recovering from COVID impacts, more than offsetting those that have been COVID beneficiaries (e.g. retail). Our concern is around forecast FY23 margins, which show a significant step up over both FY19 and FY22 levels, present a high hurdle for earnings growth into next year. In our view, the market is too bullish on margins given the cost inflationary pressures and lack of cost levers discussed earlier.
While this may present a relatively negative picture on the earnings front for Small Industrials, we see the benefit of small cap investing with a large universe of stocks is that there are always companies that we believe can grow and deliver on earnings expectations regardless of economic conditions. In our recent discussions with small cap industrial companies, we have found businesses that appear very similar on the surface – operating in the same sectors and competing in the same regions – and yet on the basis of our research we believe that they are likely to have vastly different levels of success in navigating the current cost challenges and being able to grow earnings.
We are focused on investing in companies that can deliver on earnings expectations while avoiding short-term downgrades. In this environment, that means finding companies that may have internal growth drivers that are unrelated to economic conditions, true pricing power or a nimble management team able to right size the cost base quickly.
Despite the challenging cost environment, there are many stocks we think can meet or even exceed earnings expectations at the upcoming reporting season. Finding these stocks will require a far greater focus on company specific detail and drivers, rather than broad-based thematic investing which has worked so well in recent years.
*Note: we exclude resources companies from this analysis due to the volatility in commodity prices and therefore earnings for these companies
**Source: Collins Foods Limited – FY22 Results – ASX Release (28/06/22)
Disclaimer
This material was prepared by Maple-Brown Abbott Ltd ABN 73 001 208 564, Australian Financial Service Licence No. 237296 (MBA). MBA is registered as an investment advisor with the United State Securities and Exchange Commission under the Investment Advisers Act of 1940. This information is provided for information purposes only. This material does not constitute investment advice or an investment recommendation of any kind and should not be relied upon as such. This information is general information only and it does not have regard to any investor’s investment objectives, financial situation or needs. Before making any investment decision, you should seek independent investment, legal, tax, accounting or other professional advice as appropriate. This material does not constitute an offer or solicitation by anyone in any jurisdiction.
This material is not an advertisement and is not directed at any person in any jurisdiction where the publication or availability of the information is prohibited or restricted by law. Past performance is not a reliable indicator of future performance. Any comments about investments are not a recommendation to buy, sell or hold. Any views expressed on individual stocks or other investments, or any forecasts or estimates, are point in time views and may be based on certain assumptions and qualifications not set out in part or in full in this information. The views and opinions contained herein are those of the authors as at the date of publication and are subject to change due to market and other conditions. Such views and opinions may not necessarily represent those expressed or reflected in other MBA communications, strategies or funds. Information derived from sources is believed to be accurate, however such information has not been independently verified and may be subject to assumptions and qualifications compiled by the relevant source and this material does not purport to provide a complete description of all or any such assumptions and qualifications. To the extent permitted by law, neither MBA, nor any of its related parties, directors or employees, make any representation or warranty as to the accuracy, completeness, reasonableness or reliability of the information contained herein, or accept liability or responsibility for any losses, whether direct, indirect or consequential, relating to, or arising from, the use or reliance on any part of this material. This information is current as at 4 July 2022 and is subject to change at any time without notice.
© 2022 Maple-Brown Abbott Limited.
Interested in investing with us?
We believe it is through combining our earnings-based valuation approach with a focus on sustainability that the strategy will deliver enhanced investment performance in Australian small companies.