


Article
8 min
Powering the digital age: navigating data center growth and decarbonisation


Infrastructure assets such as toll roads, water utilities, electricity grids and telecommunication towers provide essential services to society. Specifically, they are essential for large populations, are fundamental to the functioning of society and are critical to future economic growth.
Infrastructure businesses are typically physical asset networks operating in monopoly/duopoly markets. They are often less vulnerable to competition (as assets are difficult to replace or duplicate) and less aligned to economic and commodity price cycles.
We have observed that infrastructure’s total return profile traditionally appeals to investors seeking more stable, reliable investment returns. Over the long-term, infrastructure earnings growth has been ~6% coupled with 3–4% dividend yields.1
Infrastructure assets typically generate stable and resilient cash flows. Furthermore, cash flows are often linked to contracts or concessions containing inflation-linked pricing. A peg to inflation serves as a natural hedge to other inflationary forces, providing earnings resilience.
Infrastructure assets have exhibited lower correlation to traditional asset classes such as equities and bonds, potentially reducing overall portfolio volatility and enhancing risk-adjusted returns. Infrastructure’s lower correlation with broader equity markets and other asset classes stems from its stable, predictable cash flows, essential service nature, inflation protection mechanisms, regulatory frameworks and diverse revenue sources.
Infrastructure growth and adaptation is central to the largest and most important global ‘mega-themes’. These themes include:
This mega-theme centers around the transformation of the global energy landscape towards a cleaner future.
We believe these factors combine to create a significant growth opportunity for infrastructure companies involved in electricity transmission, distribution and related infrastructure.
The ever-increasing demand for data and connectivity is another major infrastructure growth driver. This mega-theme focuses on the global shift towards a digitalised economy necessitating significant investment in telecommunications infrastructure and reliable and efficient electricity supply.
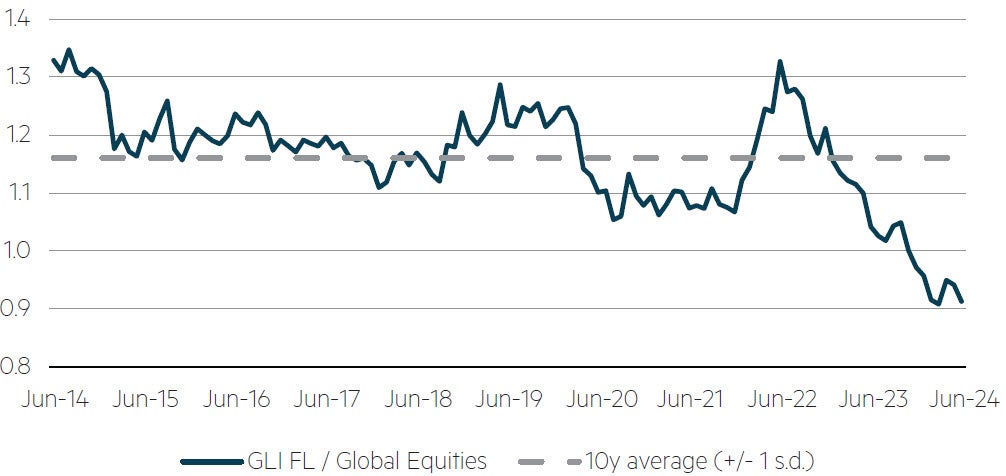
Listed infrastructure, despite its above-average earnings growth, is currently trading at discounted levels relative to our valuations and history.
Over the past year, a combination of economic, financial, regulatory and market factors have driven a notable departure in the pricing of infrastructure assets from the long-term trend, resulting in compressed valuations. We believe the recent significant interest in large-cap technology and growth sectors, fuelled by their strong financial performance and growth potential, has been a central driver of this divergence. Specifically, the confluence of rising interest rates, sector rotation, regulatory and political risks, and pandemic recovery dynamics has collectively contributed to infrastructure valuations reaching a 10-year low relative to global equities.
GLI Focus List relative to Global Equities – Forward EV/EBITDA2
(10 years to 30 June 2024)
Source: MBA, June 2024.
Most listed infrastructure companies are increasingly prioritising environmental, social and governance (‘ESG’) considerations, aligning with global sustainability objectives and investor preferences.
Infrastructure assets with strong ESG credentials may not only contribute to positive financial and non-financial outcomes but also exhibit long-term resilience and value creation potential through new investment opportunities.
"... For investors looking to build an allocation to infrastructure, listed markets currently offer a relatively attractive valuation entry point ..."
The underlying assets in the listed and unlisted infrastructure market are ultimately equivalent, however as the chart below shows, a material valuation dispersion has developed since the pandemic. Over the past decade, returns from unlisted infrastructure have been driven by higher debt levels and higher valuations. For investors looking to build an allocation to infrastructure, listed markets currently offer a relatively attractive valuation entry point compared to both the unlisted infrastructure sector and the broader universe of global equities.
Valuation differential between listed and unlisted infrastructure over the past decade (EV/EBITDA)3
Source: Maple-Brown Abbott internal research, Bloomberg, Infralogic, Sentieo, as at 31 December 2023.
The Maple-Brown Abbott Global Listed Infrastructure business was established in 2012 as a partnership between the founding Principals and Maple-Brown Abbott Limited. The Co-Founders, who are also Portfolio Managers, have worked together for more than 15 years, 10 years at Maple-Brown Abbott and prior to that at Macquarie, and are supported by a high-calibre team including a fourth portfolio manager and an ESG specialist.
We use a tight definition of infrastructure assets by considering companies with low-volatility cashflows and inflation protection capabilities, to achieve a different risk and return profile to global equities, and over the years we have witnessed the more defensive nature of these assets, particularly in down markets.
We take a high conviction approach to ensure our strongest stock views are included in the portfolio. As a result, the strategy is expected to have between 25 and 35 global investments at any one time.
While we have a tight definition of infrastructure and strict capacity limits, we remain flexible enough to develop bespoke solutions for clients.
Learn more
Disclaimer
This information is prepared and issued by Maple-Brown Abbott Ltd ABN 73 001 208 564, AFSL. 237296 (‘MBA’) as the Responsible Entity of the Maple-Brown Abbott Global Listed Infrastructure Fund (‘Fund’). This presentation contains general information only, and does not take into account your investment objectives, financial situation or specific needs.
Before making a decision whether to acquire, or to continue to hold an investment in the Fund, investors should obtain independent financial advice and consider the current PDS and Target Market Determination (TMD) or any other relevant disclosure document of those products. For the Fund, the PDS, AIB and TMD are available at maple-brownabbott.com/document-library or by calling 1300 097 995.
Any views expressed on individual stocks or other investments, or any forecasts or estimates, are not a recommendation to buy, sell or hold, they are point in time views and may be based on certain assumptions and qualifications not set out in part or in full in this document. Information derived from sources is believed to be accurate, however such information has not been independently verified and may be subject to assumptions and qualifications not described in this document. To the extent permitted by law, neither MBA, nor any of its related parties, directors or employees, make any representation or warranty as to the accuracy, completeness, reasonableness or reliability of this information, or accept liability or responsibility for any losses, whether direct, indirect or consequential, relating to, or arising from, the use or reliance on this information. Units in the Fund mentioned in this presentation are issued by MBA.
This information is current as of 25 July 2024 and is subject to change at any time without notice.
© 2024 Maple-Brown Abbott Limited.
Interested in investing with us?
We use a tight definition of infrastructure assets with low-volatility cashflows and inflation protection to achieve diversification benefits with other asset classes, such as global equities.