


Article
4 min
Australian small caps at an inflection point this reporting season


The gold price is at all-time highs, and we see share price upside for the Australian small cap gold mining sector for the following reasons:
In summary, we believe select Australian small cap gold miners offer attractive valuation and earnings metrics relative to historical levels.
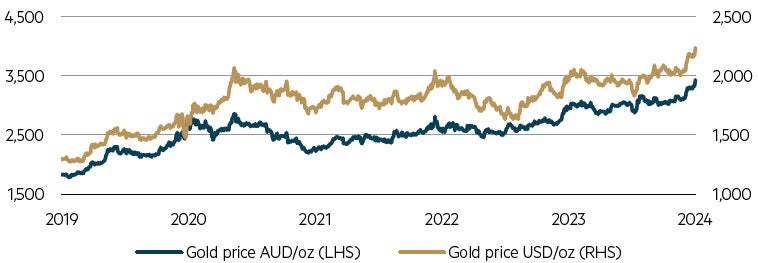
Over the past 12 months to the end of March 2024, the gold price per ounce in USD and AUD terms has risen 13% and 17% respectively, both reaching all-time high in nominal terms (although still below on a real basis) and compounding double digit returns over the past five years (12% pa and 14% pa in USD and AUD terms, respectively) – not a bad outcome for this ‘pet rock’ that doesn’t offer a yield to investors.
Gold price in ounces in AUD and USD terms
Source: FactSet, March 2024.
The strong performance has been boasted first by increased geopolitical risk premium, notably the Russian/Ukraine conflict and most recent Middle East tensions, although history suggest this impact is typically short-lived. Most recently, it was believed that the rally has been supported by expectations of global central banks easing official interest rates although so far in the 2024 those expectations have been wound back which hasn’t impacted the gold price trajectory. Easing cycles have historically been favourable for gold and has provided the gold price with material tailwinds in the 12 months following the first cut in previous cycles. So far this calendar year, we have seen a stabilisation in the previous downward trajectory in inflation rates with signs of a potential re-acceleration in some broad-based indicators which is typically supportive for the gold price.
This is happening at the same time as Western investors continue to significantly liquidate gold, as measured by physically-backed gold ETF holdings. Specifically, the February 2024 ETF holdings in tonnes is 20% lower than in October 2020.* In addition, the gold price is outperforming both nominal and real (TIPS) yields and has shrugged off relative USD strength, which is atypical for the commodity.
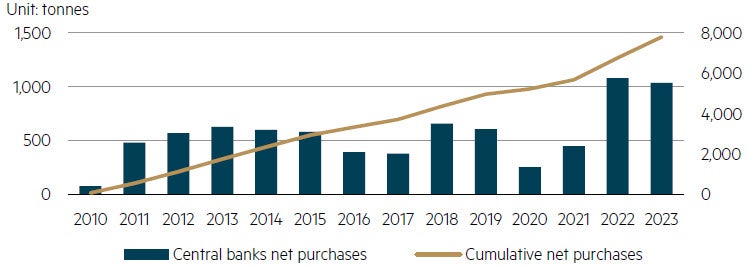
Gold liquidations have been more than offset by central bank purchases. According to the World Gold Council, central bank net gold purchases totalled 1,037 tonnes, which was just below the 2022 record and over double the 10-year average to 2021.** The buying has been driven primarily by Chinese and Russian central banks given increased geopolitical tensions. Russia in particular has moved away from US Treasuries as a safe haven investment given the freezing of approximately US$300 billion of Russian state assets by the US and Europe to potentially pay for the Ukraine reconstruction effort.***
Gold: Annual net demand from central banks
Source: Metals Focus, Refinitiv GFMS, World Gold Council, December 2023.
We believe investment markets are also becoming increasingly concerned regarding the willingness of central banks to print unlimited quantities of fiat currencies, notably during the GFC and COVID periods. This is further compounded by fiscal dominance with ballooning global government debts, notably the US which ran a federal deficit of US$1.7 trillion in 2023 and has a national debt approaching US$35 trillion which is over 120% of GDP. This is putting into the question the purchasing power of money.
We believe there is upside risk to consensus gold price forecasts assuming the gold price holds at current levels. Assuming the gold price remains higher for longer, this has the potential to result in material positive earnings revisions for companies at the smaller end of the Australian gold mining sector.
| Gold price (US$/oz) | 2H24 | 1H25 | 2H25 | 1H26 | 2H26 | Long term |
| Spot (end Mar’24) | 2,238 | 2,238 | 2,238 | 2,238 | 2,238 | 2,238 |
| Consensus | 2,209 | 2,135 | 2,066 | 1,931 | 1,931 | 1,670 |
| Difference (Spot – Consensus) | +29 | +103 | +172 | +307 | +307 | +568 |
Source: Consensus price based on average commodity forecasts by 4 major sell-side firms, March 2024.
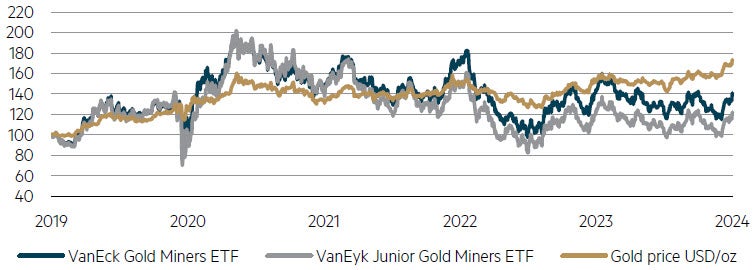
We acknowledge the global gold mining industry in totality has a poor track record of delivering sustainable returns over the cycle. Both the VanEyk Gold Miners and Junior Gold Miners ETFs have materially underperformed the gold price over the past three years, which emphasises how hard delivery from both a production and cost perspective has been in the current environment. However, select emerging Australian small cap gold developers and producers such as De Grey Mining, Emerald Resources and Genesis Minerals, have recently delivered strong returns above the underlying commodity.
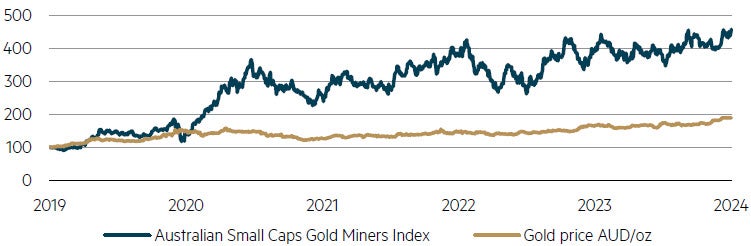
Australian small cap gold miners vs. AUD gold price
Source: FactSet, Australian Small Caps Gold Miners Index is an equally weighted index based on gold companies included in the S&P/ASX Small Ordinaries Index as at March 2024.
VanEyk Gold Miners and Junior Miners ETFs vs. USD gold price
Source: FactSet, Australian Small Caps Gold Miners Index is an equally weighted index based on gold companies included in the S&P/ASX Small Ordinaries Index as at March 2024.
Over the past 12 months to end-March 2024, the Australian small cap mining sector has returned 17%, which is broadly in line with the AUD gold price. Given the gold price is at all time highs and these companies are typically higher cost producers/developers which offer investors significant operating leverage, we believe there is potential for gold equities to outperform from here.
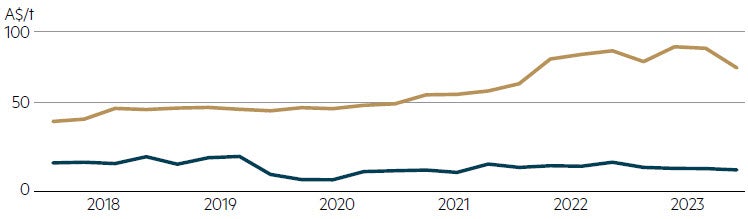
Over the past few years, the smaller end of the Australian gold mining sector has been plagued by higher costs from both a capital and operating perspective given cost inflation pressures and labour constraints, particularly in Western Australia. Our industry channel checks and the review of mining costs across Australian open pit and underground mines are pointing to a stabilisation and even an improvement in mining costs over the past 12 months.
Australian gold mining costs experiencing moderating costs
Source: Goldman Sachs Equity Research, Gold: Ongoing capex risk vs. market expectations, data on ~10–15 Australian open pit / underground mines with reported split out of mining costs, 10 January 2024.
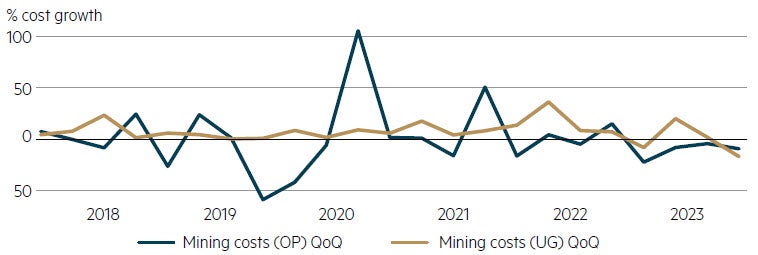
Australian gold mining cost declines being experienced for both open pit and underground mines
Source: Goldman Sachs Equity Research, Gold: Ongoing capex risk vs. market expectations, data on ~10–15 Australian open pit / underground mines with reported split out of mining costs, 10 January 2024.
Anecdotal discussions with gold miners indicate that labour pressure is easing, validated by the decline in job advertisements in the mining services industry (many of which service the gold miners). This has been assisted by the recent closure of nickel and lithium mines given commodity price pressures which is easing mining industry labour constraints.
Mining services job openings index
Source: Job openings for ASX listed mining services companies, March 2024.
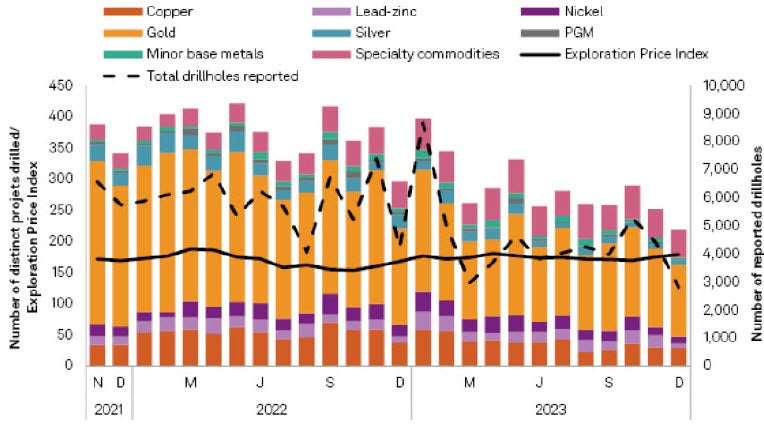
Declining exploration spend and depleting reserves means there is a limited organic growth profile for many miners. Given the recent strong gold price and rising producer margins, this promotes merger activity to backfill declining production profiles. In addition, increasing complexity and time taken to permit new projects means it is likely now cheaper and easier to buy versus build.
Project drilling activity by commodity (November 2021 – December 2023)
Source: Imdex ASX presentation, February 2024, S&P Global Market Intelligence, 8 January 2024.
We have also seen early-stage explorers continuing to struggle to attract new capital with the number of global junior fund raisings in February 2024 being lower by 33% relative to the previous period last year and the lowest reported since January 2022^ which makes them easy targets in the current environment.
We are now seeing signs that corporate activity is increasing at the smaller end of the market including Genesis Minerals – St Barbara (Gwalia), Silver Lake Resources – Red 5, Perseus Mining – OreCorp and Westgold Resources – Karora Resources tie-ups.
Current stock valuations broadly imply gold prices around long-term pricing which is well below the current spot price. Valuations have held up best for producers with high quality projects (for example Perseus Mining) that continue to deliver production growth, meet cost guidance and build cash reserves.
We continue to believe valuations for select producers remain relatively undemanding, particularly in the context of all-time high gold prices. Also, we believe companies with large resource bases provide optionality to high gold prices and will be sought out by investors. We expect improving investor interest for both developers with high quality, well-funded projects closer to production as well as exploration companies assuming the current gold price stabilises or the rally continues.
Spartan Resources (SPR) is an attractive high-grade, low-cost gold prospect in Western Australia in an increasingly acquisitive local small cap gold market where existing producers are struggling to grow organically.
The company’s strategy is to build out and restart the Dalgaranga gold project, which has seen its prospects materially improve after discovery of the high-grade Never Never deposit. Management has done an impressive job over-delivering on exploration targets and sees the potential for continued growth in the resource base this year, during which a decision to restart the project is likely to be made.
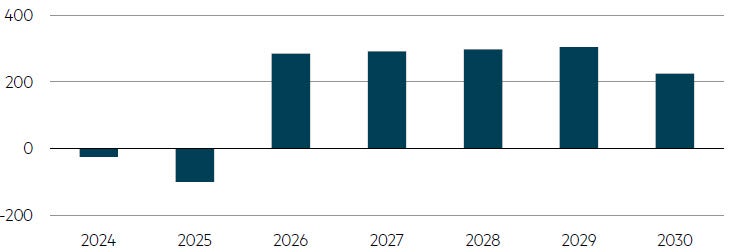
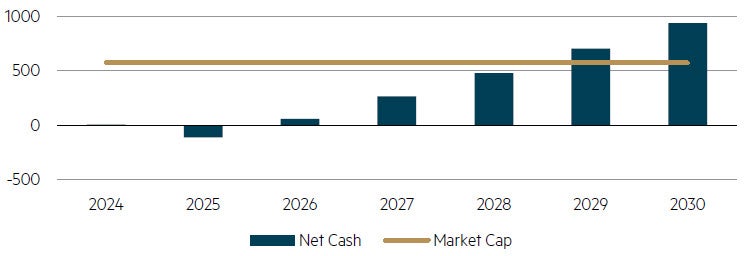
The Never Never mineral resource is currently one million ounces at close to a 6g/tonne grade with upside risk to the resource base given the highly successful exploration program to date. We estimate a relatively low capital expenditure to restart the project with the potential to generate significant free cash flow annually and generate cash levels to equal the current market capitalisation by 2028/29.
Potential for significant cashflow generation
Source: MBA estimates, company data, April 2024.
Forecast net cash and market capitalisation over time
Source: MBA estimates, company data, April 2024.
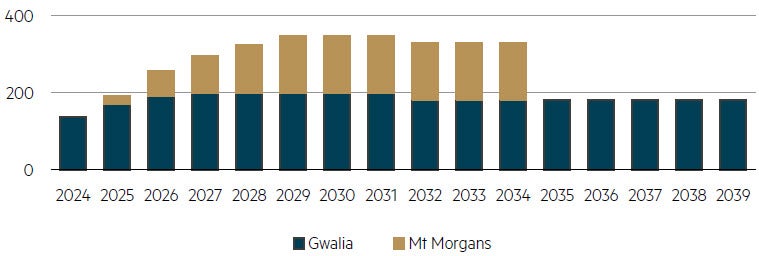
Genesis Minerals (GMD) is run by a high quality management team, which are ex-Saracen Minerals / Northern Star Resources and lead by Raleigh Finlayson. The company is turning around an underperforming asset base and leveraging other deposits in the Leonora and Laverton regions in Western Australia. Genesis Minerals is unique given the large number of deposits in a single region in addition to the significant resource base. The recently released updated mine plan goes out to 2039 and assumes four million ounces of total production, which compares to 15 million ounces in resources leaving a large unmined inventory which provides significant leverage to a higher gold price.
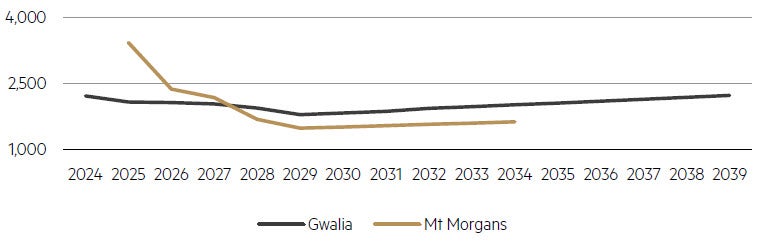
The updated mine was largely in line with market production expectations (300koz in FY28 and 325koz in FY29) although with higher near-term costs (AUD2,350/oz All-In Sustaining Costs in both FY24 and FY25) and much higher capital expenditure. As was the case during their time at Saracen, management targets are usually conservative with upside risk to Tower Hill entering the mine plan ahead of guidance and the potential for higher grades at Gwalia. Exploration is also ramping up with upside risk in the key regions around Gwalia, Ulysses and Tower Hill which should result in the company maintaining a 350-400koz pa rate long into the future.
Forecast production (‘000 oz)
Source: MBA estimates, company data, April 2024.
All-In Sustaining Costs (AISC, AUD/oz)
Source: MBA estimates, company data, March 2024.
In summary, we believe the Australian small cap gold sector will attract increased investor interest given it represents approximately 9% (by market capitalisation) of the S&P/ASX Small Ordinaries Index (as at end-March 2024) and has the potential to react positively to the recent gold price move. We believe there is upside potential for companies that can deliver on production guidance, manage costs effectively and offer significant operating leverage in addition to the potential for takeover activity to ramp up at the smaller end of the market.
* World Gold Council, Gold ETF Flows: February 2024, 7 March 2024.
** World Gold Council, Gold Demand Trends Full Year 2023, 31 January 2024.
*** Foreign Policy (FP), 30 January 2024.
^ Citi Research, S&P Capital IQ Pro, Imdex Limited – Mixed bag in February, but are we edging closer to mid-cycle?, 14 March 2024.
Disclaimer
This information is prepared and issued by Maple-Brown Abbott Ltd ABN 73 001 208 564, AFSL. 237296 (‘MBA’) as the Responsible Entity of the Maple-Brown Abbott Australian Smaller Companies Fund (‘Fund’). This presentation contains general information only, and does not take into account your investment objectives, financial situation or specific needs.
Before making a decision whether to acquire, or to continue to hold an investment in the Fund, investors should obtain independent financial advice and consider the current PDS and Target Market Determination (TMD) or any other relevant disclosure document of those products. For the Fund, the PDS, AIB and TMD are available at maple-brownabbott.com/document-library or by calling 1300 097 995.
Any views expressed on individual stocks or other investments, or any forecasts or estimates, are not a recommendation to buy, sell or hold, they are point in time views and may be based on certain assumptions and qualifications not set out in part or in full in this document. Information derived from sources is believed to be accurate, however such information has not been independently verified and may be subject to assumptions and qualifications not described in this document. To the extent permitted by law, neither MBA, nor any of its related parties, directors or employees, make any representation or warranty as to the accuracy, completeness, reasonableness or reliability of this information, or accept liability or responsibility for any losses, whether direct, indirect or consequential, relating to, or arising from, the use or reliance on this information. Units in the Fund mentioned in this presentation are issued by MBA.
This information is current as of 11 April 2024 and is subject to change at any time without notice.
© 2024 Maple-Brown Abbott Limited.
Interested in investing with us?
We believe it is through combining our earnings-based valuation approach with a focus on sustainability that the strategy will deliver enhanced investment performance in Australian small companies.